

Features:
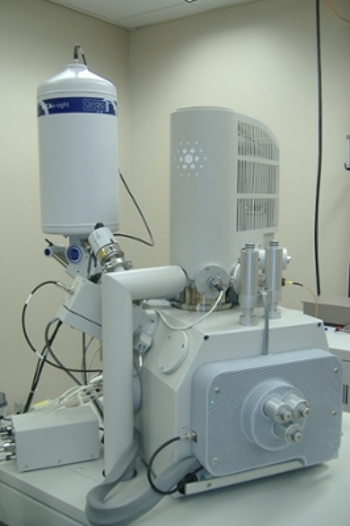
The Quanta 600F scanning electron microscope (SEM) is a versatile, high-performance instrument with three modes (high vacuum, low vacuum, and environmental) to accommodate the widest range of samples of any SEM system. The SEM system is equipped with an energy dispersive spectrometer and electron backscatter detector. In addition, the field emission gun (FEG) system contains a S/TEM detector for bright-field and dark-field sample imaging. The motorized stage has 150 mm of travel in the X and Y directions and 60 mm of travel in the Z direction. The SEM is also equiped with a Nabity lithography system to fabricate nanostructures down to sub 50 nm.JC Nabity Lithography Systems Nanometer Pattern Generation SystemThe nanometer pattern generation system (NPGS) provides a user-friendly environment for the delineation of complex structures using a commercial electron microscope, e.g., FEI Quanta 600F. The SEM combined with NPGS is a powerful lithography tool for basic research and R&D applications and can be used for the fabrication of a wide variety of devices. Pattern sizes may range from the nanometer scale up to the maximum field of view of the microscope, which can be as large as 10 mm. There are three basic steps to the pattern generation process: pattern design, parameter run file creation, and pattern writing with alignment for multilevel lithography. Energy Dispersive Spectrometer (EDS)EDS is a technique used for identifying the elemental composition of the specimen, or an area of interest thereof. The specimen is bombarded with an electron beam inside the microscope column. These electrons collide with the specimen atoms’ own electrons, knocking some of them off in the process. Positions vacated by ejected inner shell electrons are occupied by a higher energy electron from an outer shell that has given up some of its energy by emitting an X-ray. The amount of energy released depends on which shell it is transferring from / to. The atom of every element releases X-rays with unique amounts of energy, identifying it. The output of an EDS analysis is an EDS spectrum, which is just a plot of how frequently an X-ray is received for each energy level. The higher the peak in the spectrum, the more concentrated the element is in the specimen.